Orion Search Engine
View the platform: https://orion-search.org/
Check the code: https://github.com/orion-search/
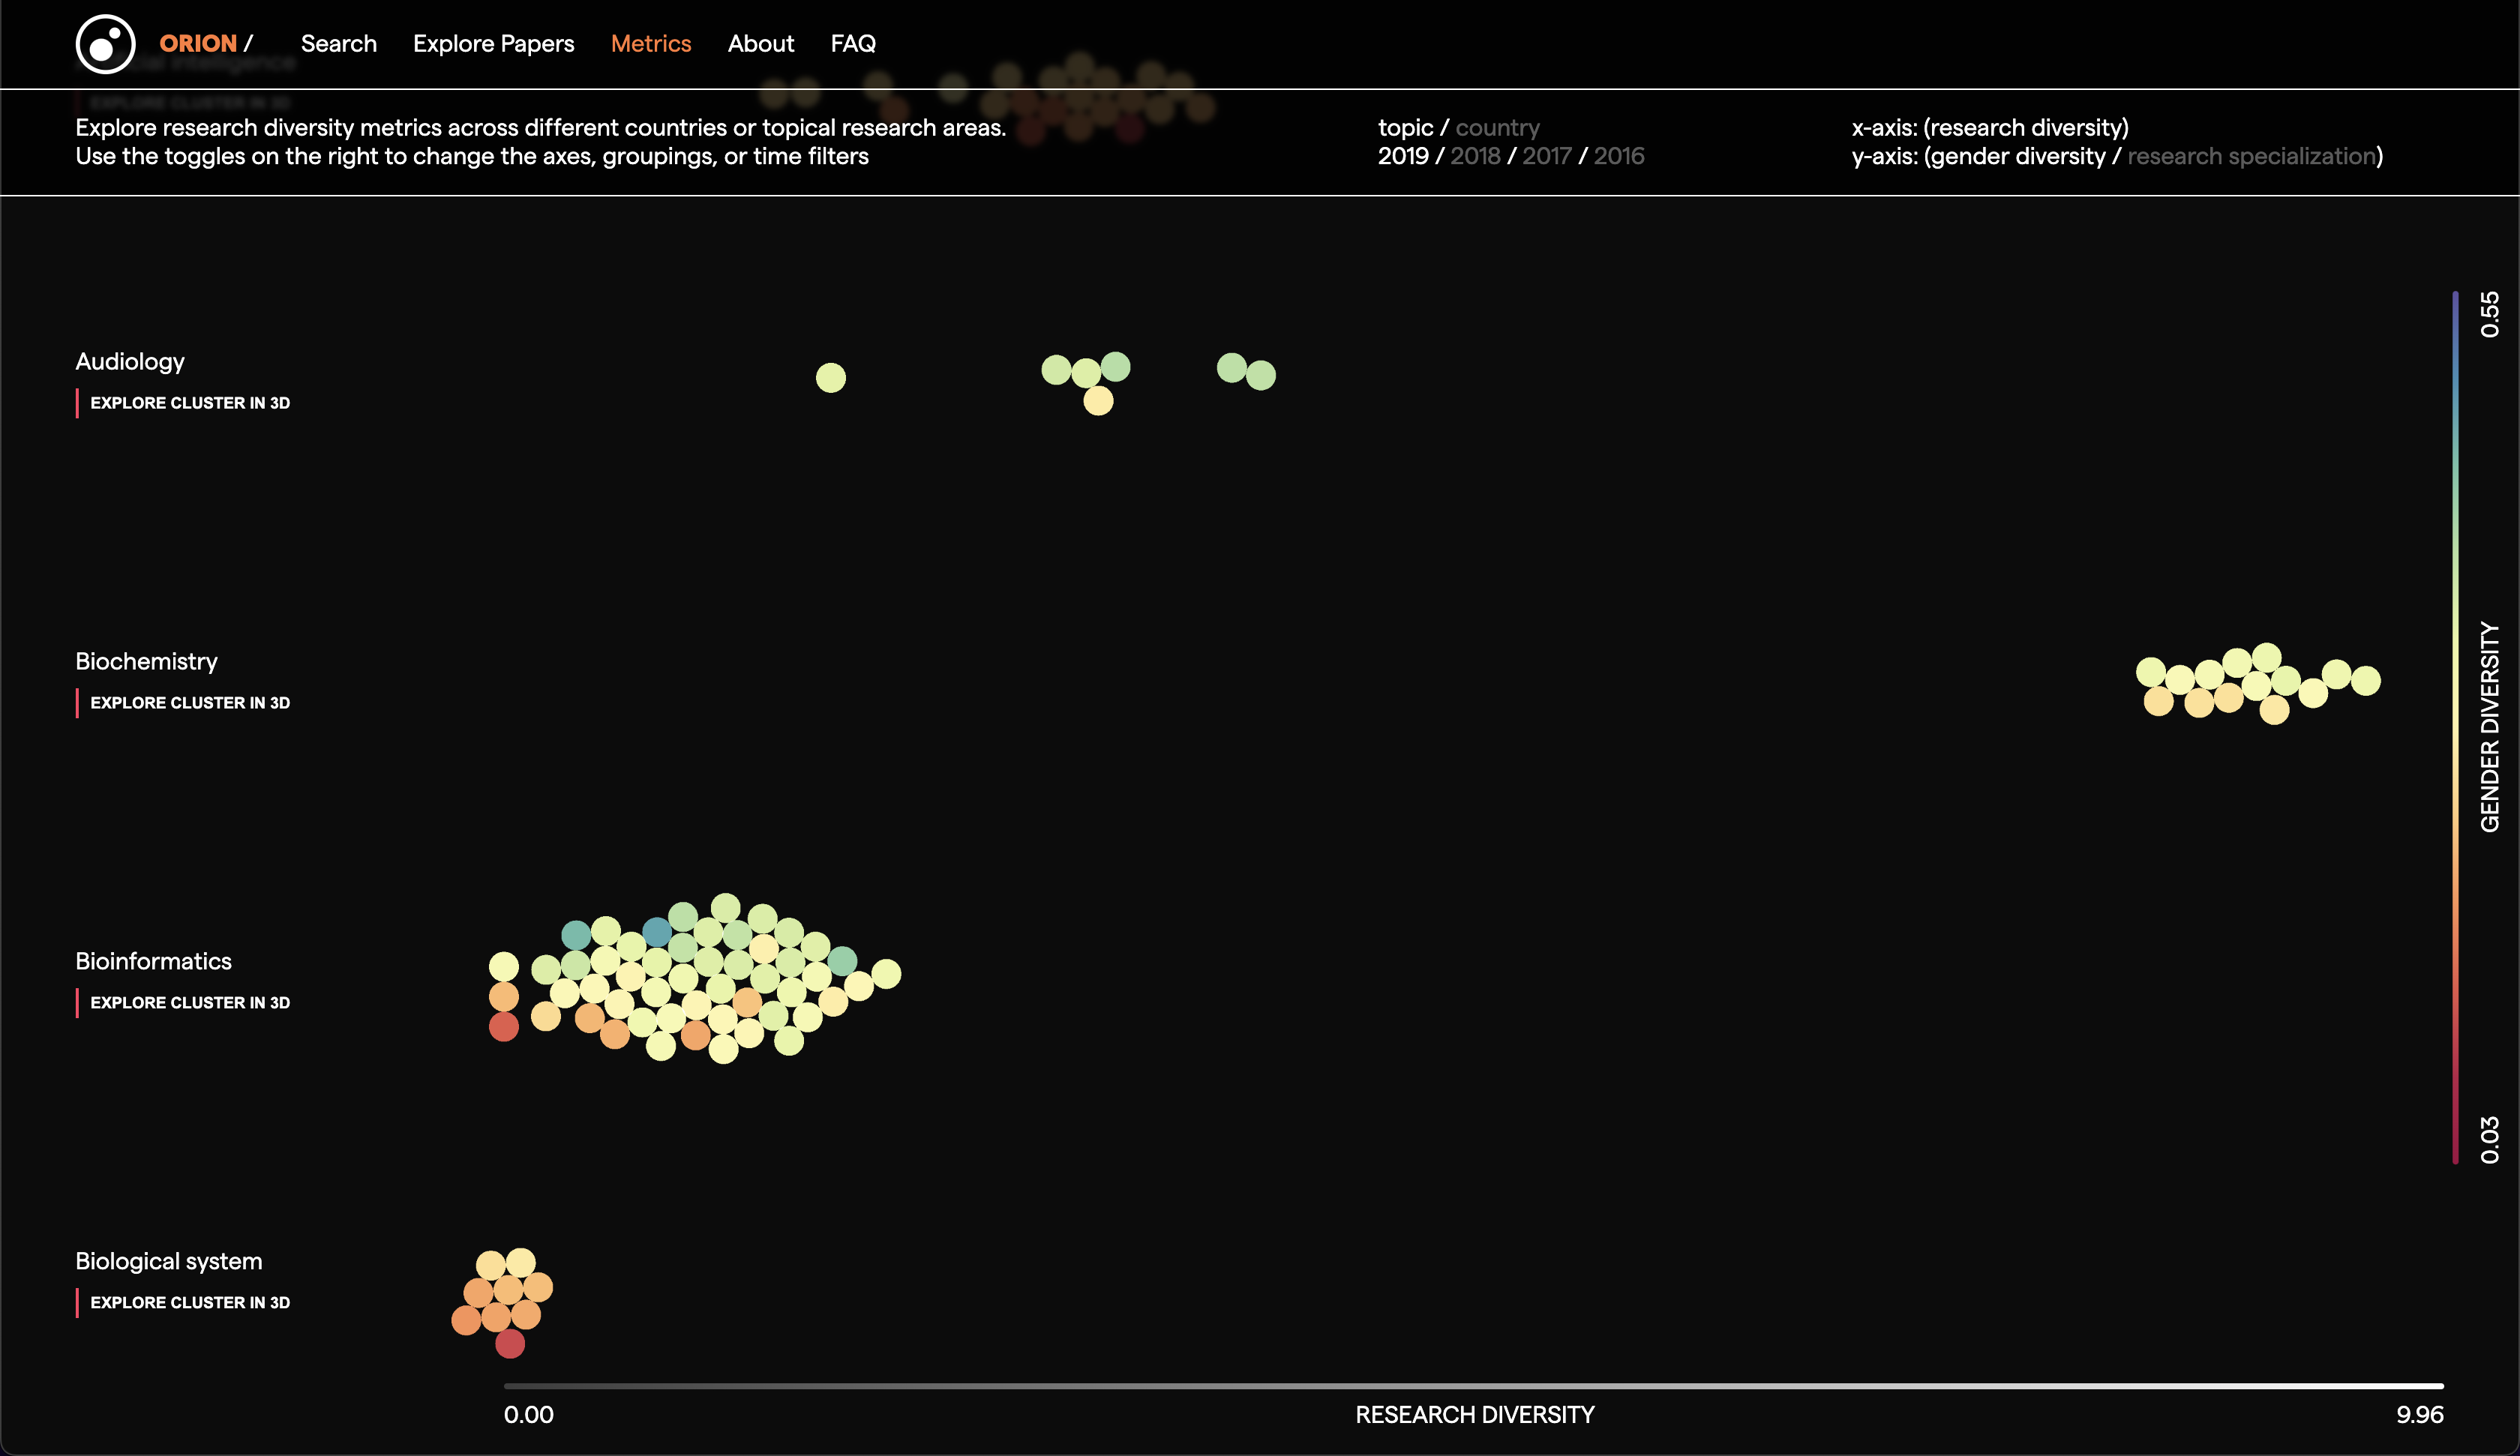
"Orion is an open-source tool to monitor and measure progress in science. Orion depends on a flexible data collection, enrichment, and analysis system that enables users to create and explore research databases. In more detail, researchers can choose an academic journal, conference or thematic topic and collect all the relevant documents from Microsoft Academic Graph. Along with every document, Orion retrieves its DOI, citations, publication year, publisher, title and abstract, fields of study, authors and their affiliations. This collection is enriched with metadata from other sources; we geocode institutional affiliations and infer authors’ gender with Google Places API and GenderAPI respectively. Lastly, Orion measures the research specialisation and interdisciplinarity as well as the gender diversity of countries and institutions.

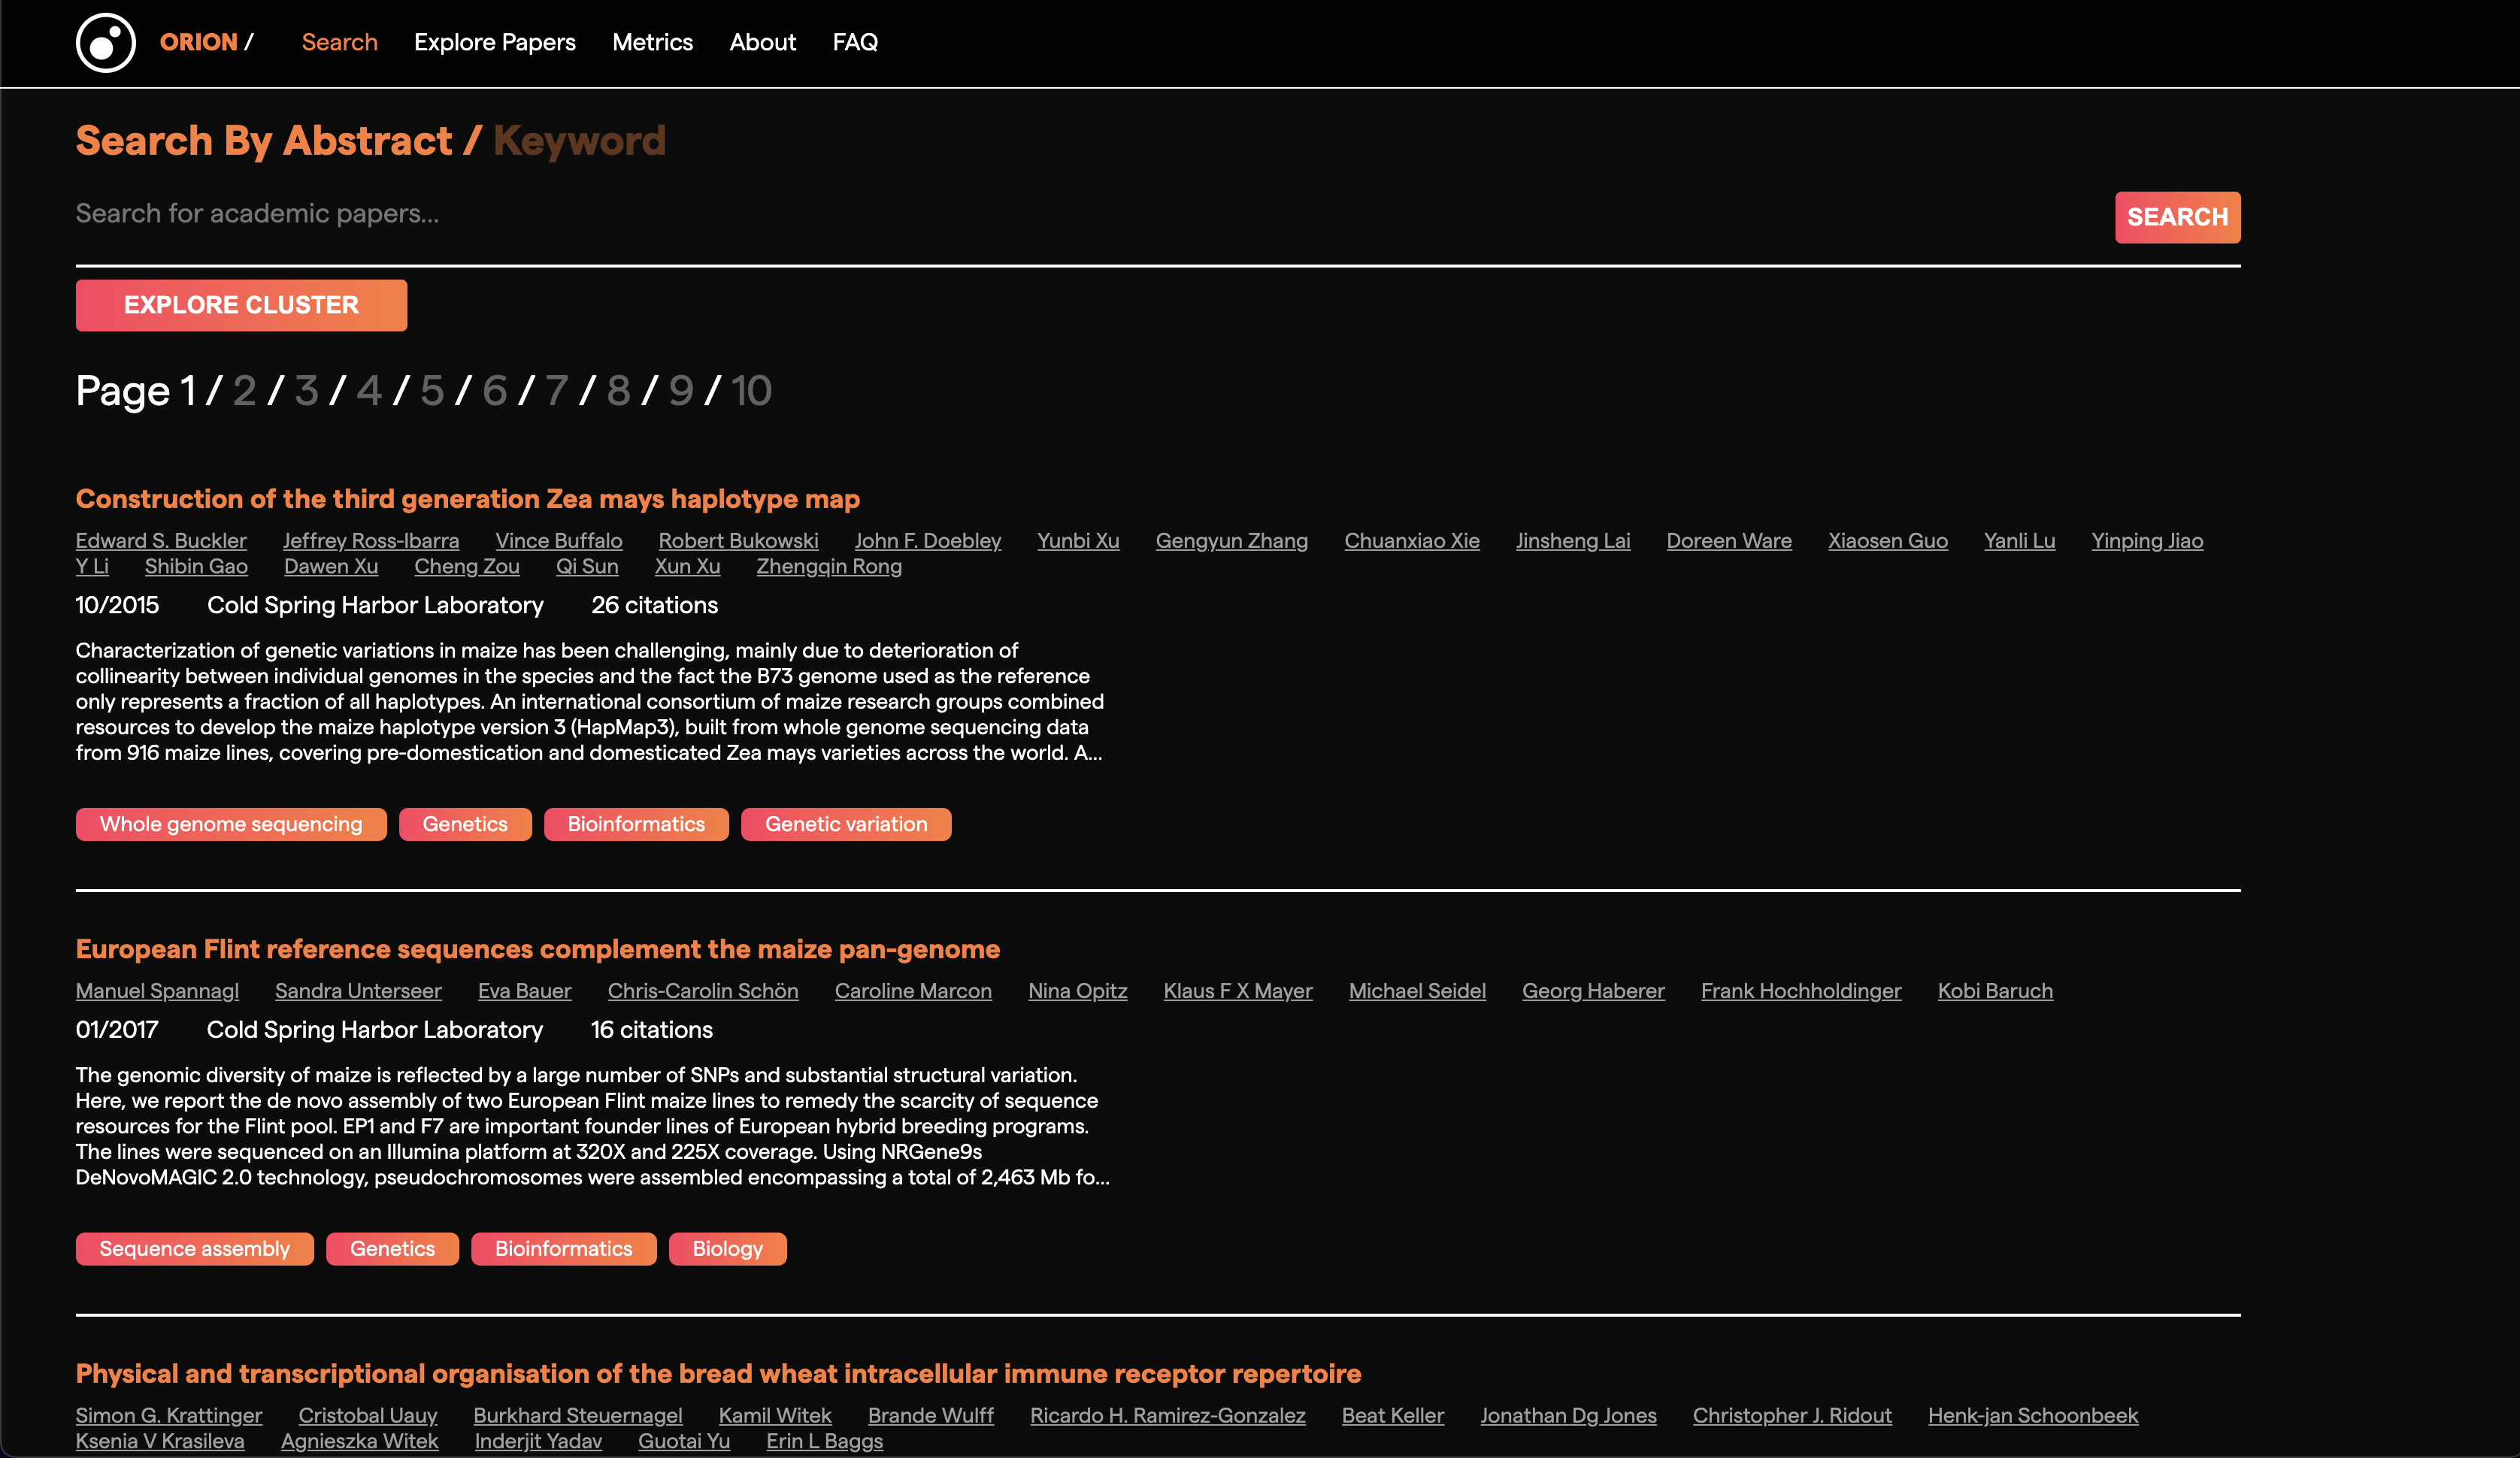
Orion also has a semantic search engine that enables researchers to retrieve relevant cuts of the rich and content-specific database they created. Users can query Orion with anything between one or two words (for example, gene editing) and a blogpost they read online. Orion uses modern machine learning methods to find a numerical representation of the users’ query and search for its closest matches in a high-dimensional, academic publication space. This flexibility can be powerful; researchers can query Orion with an abstract of their previous work, policymakers could use a news article or the executive the summary of a white paper.

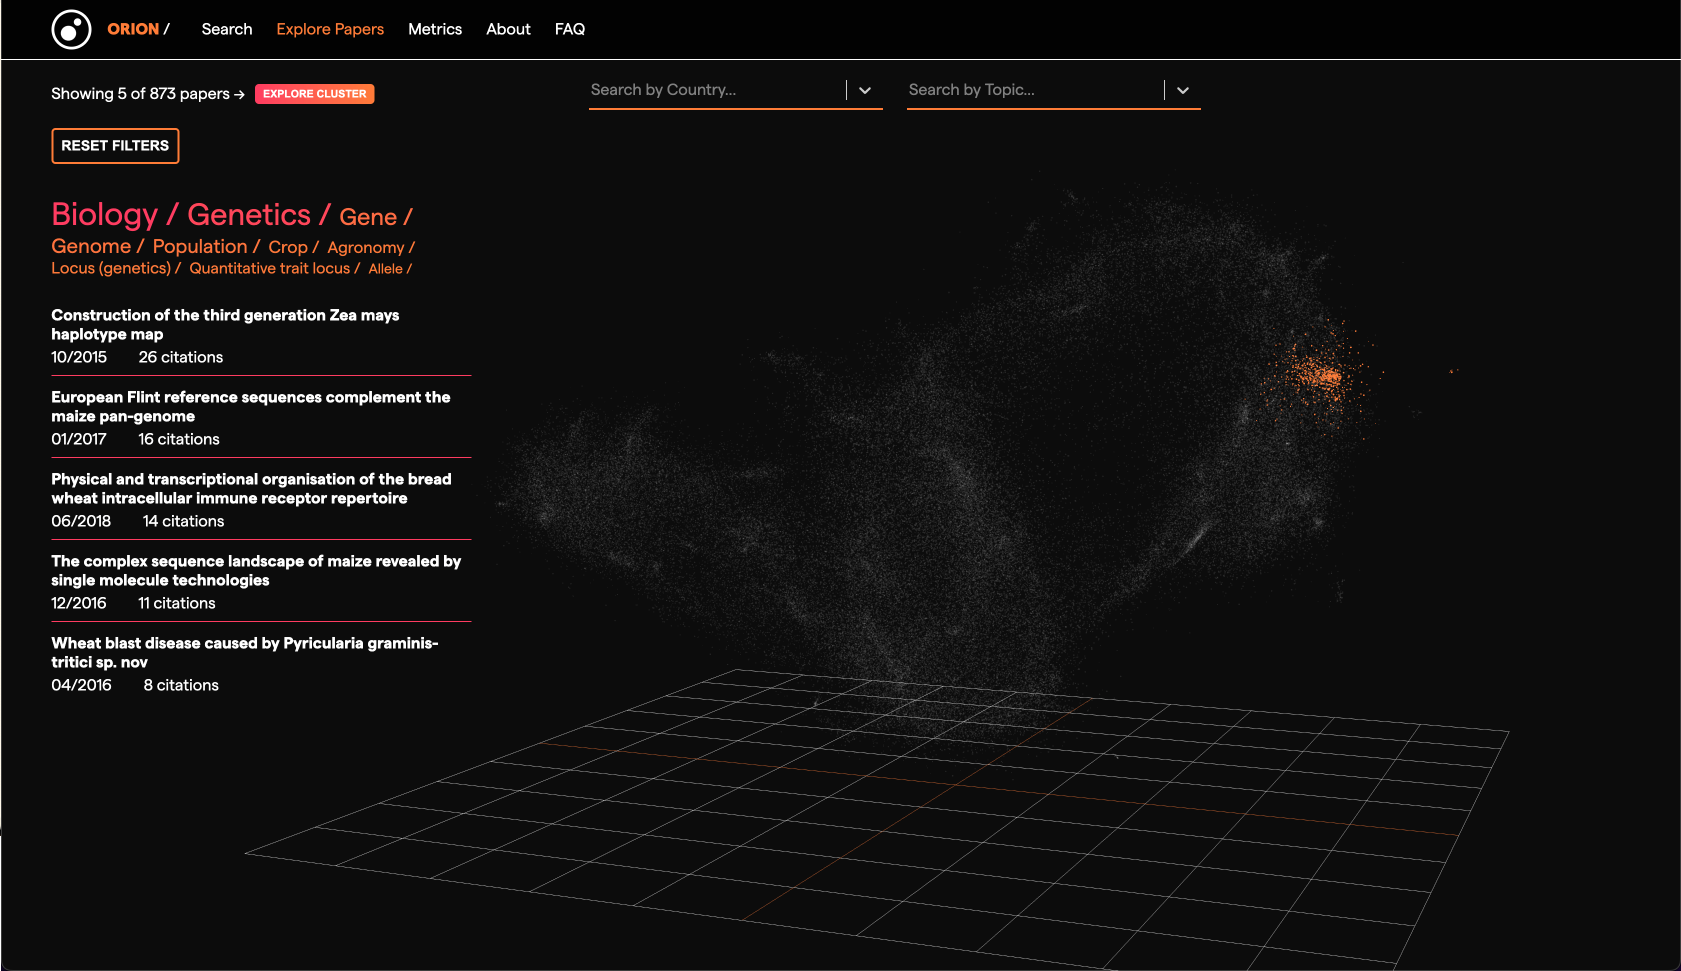
Orion makes the database and the search results available through interactive data visualisations. Our tool offers two visualisation modes. The first mode compresses the high-dimensional, academic publication space to 2D so that users can observe groups of similar papers and find more information about them. The second mode enables users to explore the taxonomy of research and understand how disciplines are connected. Then, the users can choose a topic and find out how countries and institutions perform on it. We want the visualisations to provide users with multiple entry points to the underlying data and that both modes promote the visual exploration of the research landscape. We believe that communities without a shared vocabulary will be able to explore the research landscape, observe trends and discuss findings by using the visual dictionary we are developing."
